 26.04.2018, 22:13
|
#1 |
|
Участник
|
powerobjects: How to Create a Doughnut Chart to View Campaign Leads
Источник: https://www.powerobjects.com/2018/04...ampaign-leads/
==============  In today’s blog, we are going to demonstrate how to create a doughnut chart in the Sales Hub that shows what types of campaigns produce the most leads. Add Campaign Source to the Campaign View 1. Navigate to the Campaign Leads View.  2. Click on View in the Command bar (it might be under the (…) more commands menu) 3. Click on Add Columns. In the Record Type drop-down select Source Campaign (Campaign). Click the checkbox to the left of Campaign Type. Click OK. Click Save and Close. 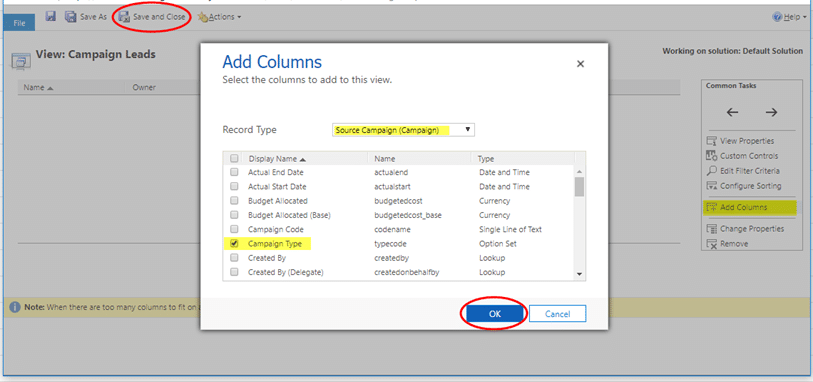 Creating a Doughnut Chart 1. Navigate to Settings > Customizations > Customize the System. 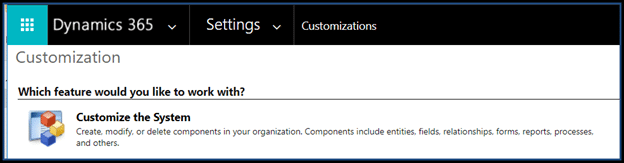 2. Navigate to the Lead entity, click on Charts and click on New. 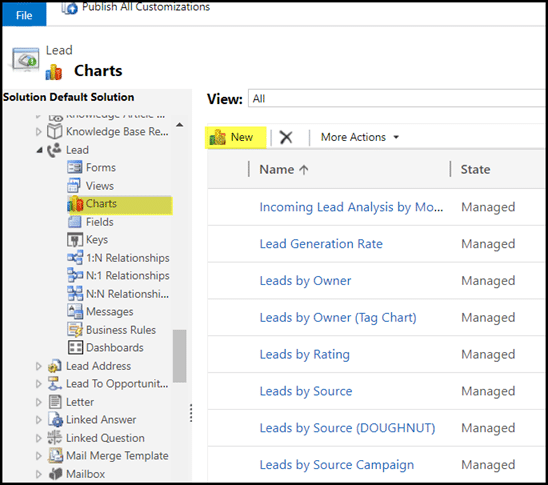 3. Click on Doughnut for the chart type, select the Campaign Leads View. Type in a name your view in the field with the “Enter chart name here” default text. (For example, “Number of Leads by Campaign Type”).
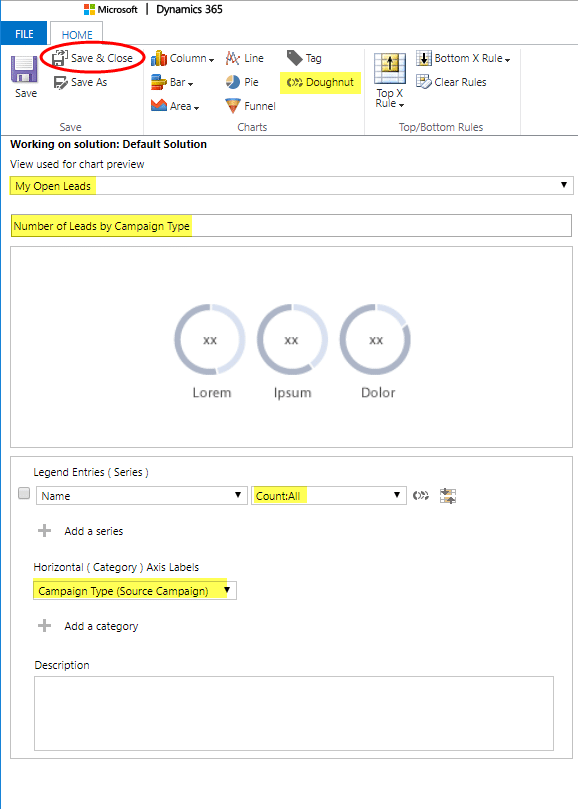 4. Navigate to the Leads section of Sales Hub. Select the Campaign Leads view. Click on Show Chart. 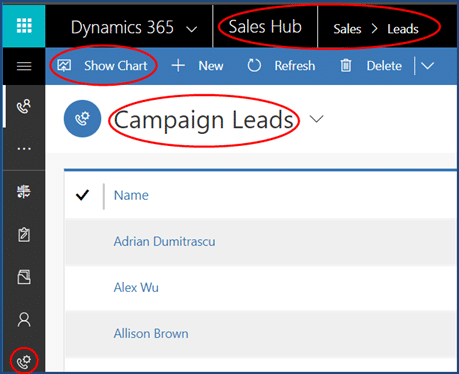 5. In the chart view, select the Number of Leads by Campaign Type (or whatever you named your view). You can expand the chart by clicking the box on the corner.  There you have it! For more information on customizing charts see The CRM Book or our blog. Happy Dynamics 365’ing! Источник: https://www.powerobjects.com/2018/04...ampaign-leads/
__________________
Расскажите о новых и интересных блогах по Microsoft Dynamics, напишите личное сообщение администратору. |
|
|
|
|
|


 Линейный вид

